How to Check Your Team’s Usage in Claude Admin (and Pick the Right Seat for Each Person)
- Category
- ClaudeClaude CodeClaude Team
- Published
- Read time
- 7 min
- Written by
- Dinuda Yaggahavita
To check your team’s usage in Claude, sign in as an Owner or Primary Owner, click your initials in the bottom-left corner, and choose Analytics. You’ll see active members, usage by product, and a Claude Code page at claude.ai/analytics/claude-code. For a per-person breakdown, open the Claude Code page and click Export, or, if your organization has extra usage turned on, scroll to “How much is Claude costing?” and click Export spend report. The Team plan has no per-member analytics view and no Analytics API, so it can’t tell you how close each person gets to their usage limits.
Key takeaways
- Usage lives under your initials → Analytics. On Team, only Owners and Primary Owners can open it.
- Per-person numbers come from two exports: the Claude Code table (always there) and the spend report (only shown when extra usage is on). Both lag by about a day.
- Claude Code has its own dashboard at claude.ai/analytics/claude-code, with a leaderboard you can export.
- Team plans don’t get per-member analytics or the Analytics API. Both are Enterprise only.
- To choose Standard or Premium for someone, you need to know how often they hit their 5-hour and weekly limits. Claude’s admin doesn’t show that.
I went looking for this myself. We had a few people on Claude Team, some of them living in Claude Code all day, and I wanted to know one thing: who actually needs a Premium seat?
Claude’s admin answers part of that. This post covers where everything is, what each screen tells you, and the one question it can’t answer yet.
Where is team usage in the Claude admin?
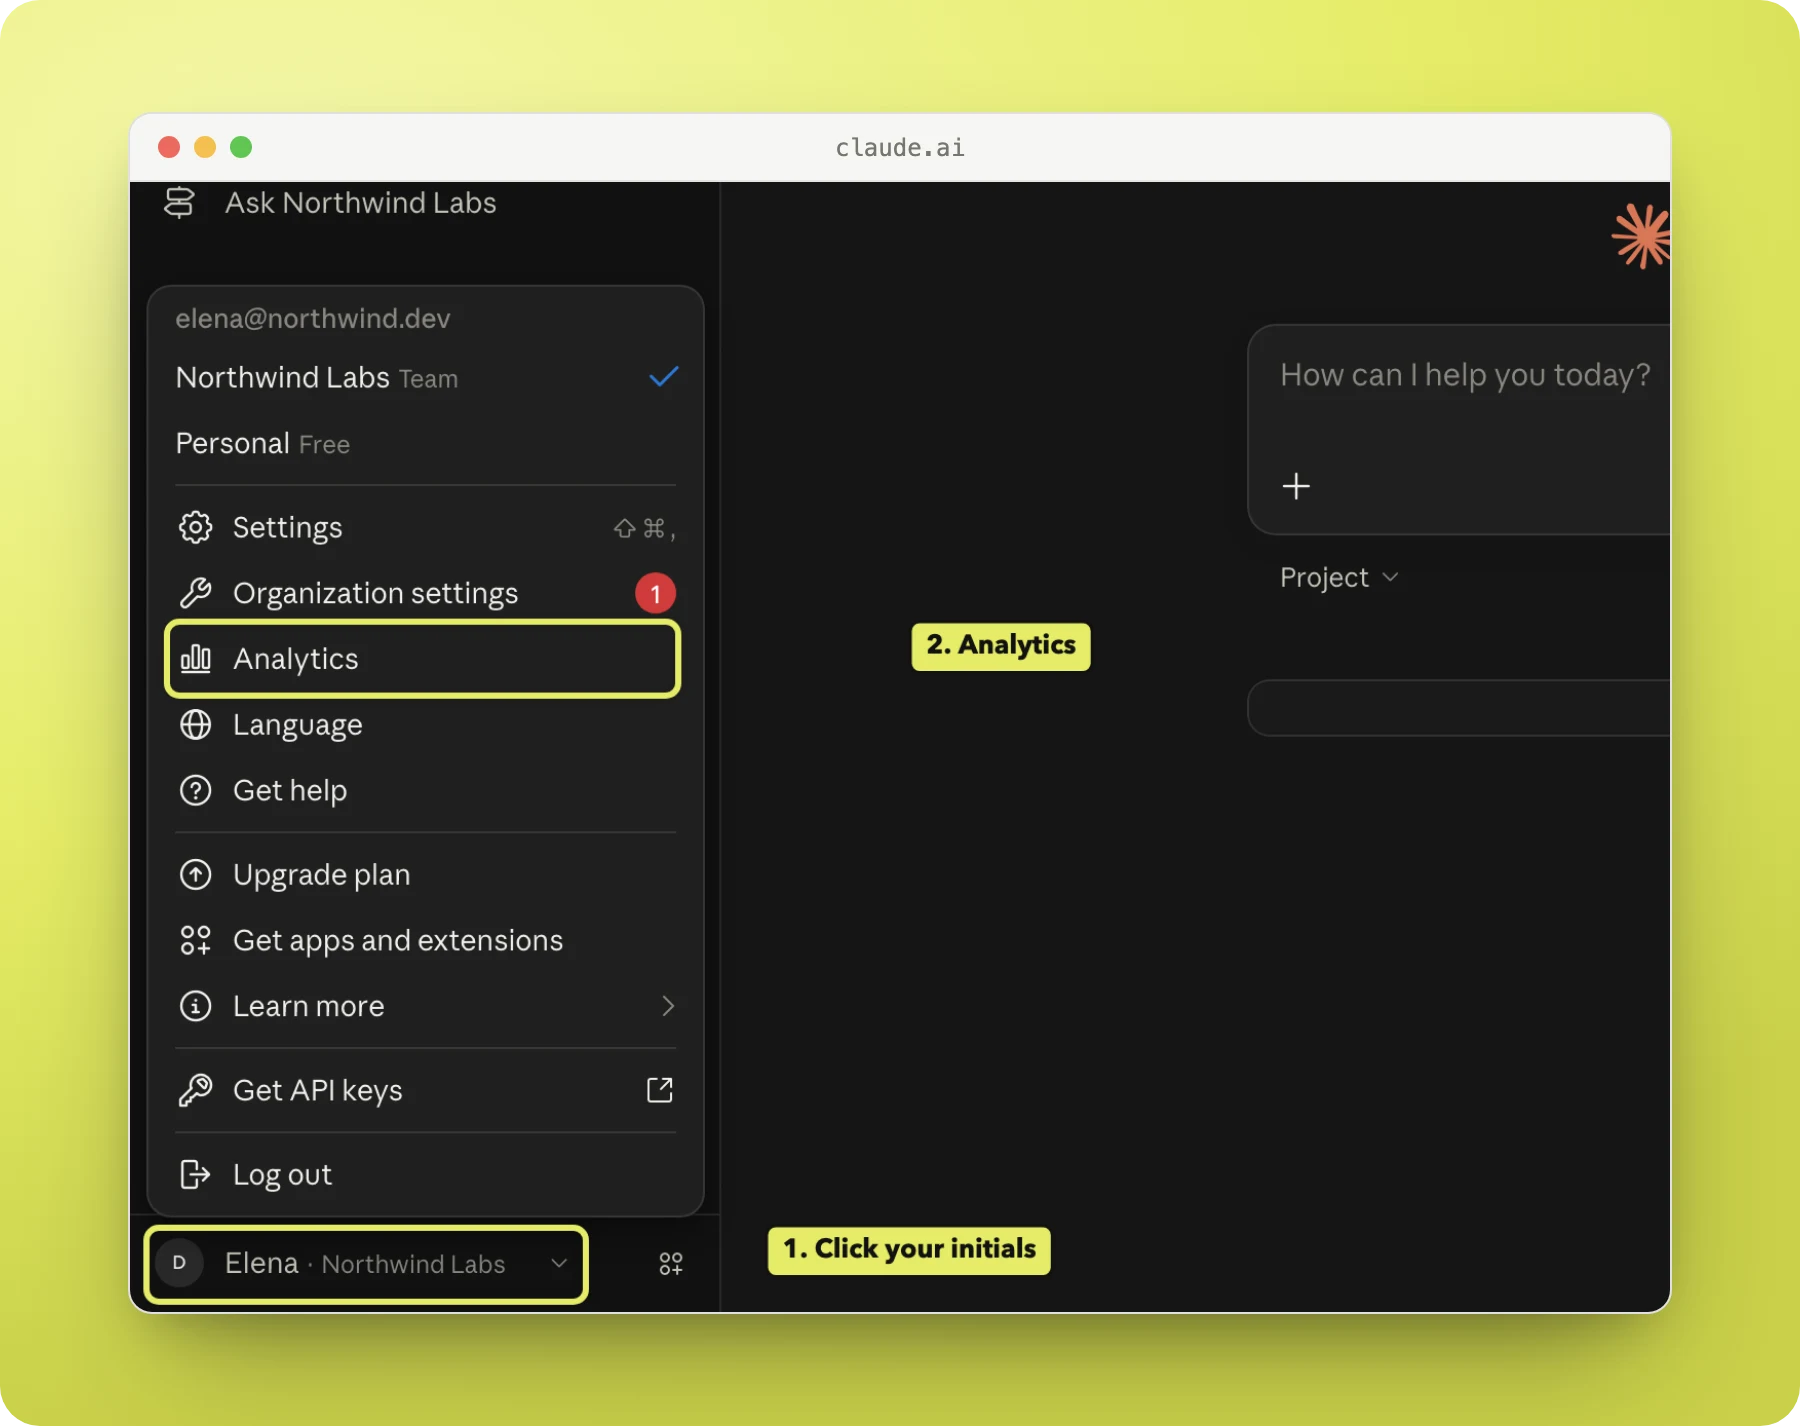
- 1. Sign in as an Owner or Primary Owner. On Team, nobody else can open Analytics. On Enterprise, Admins can too, but they don’t see spend.
- 2. Click your initials in the bottom-left corner.
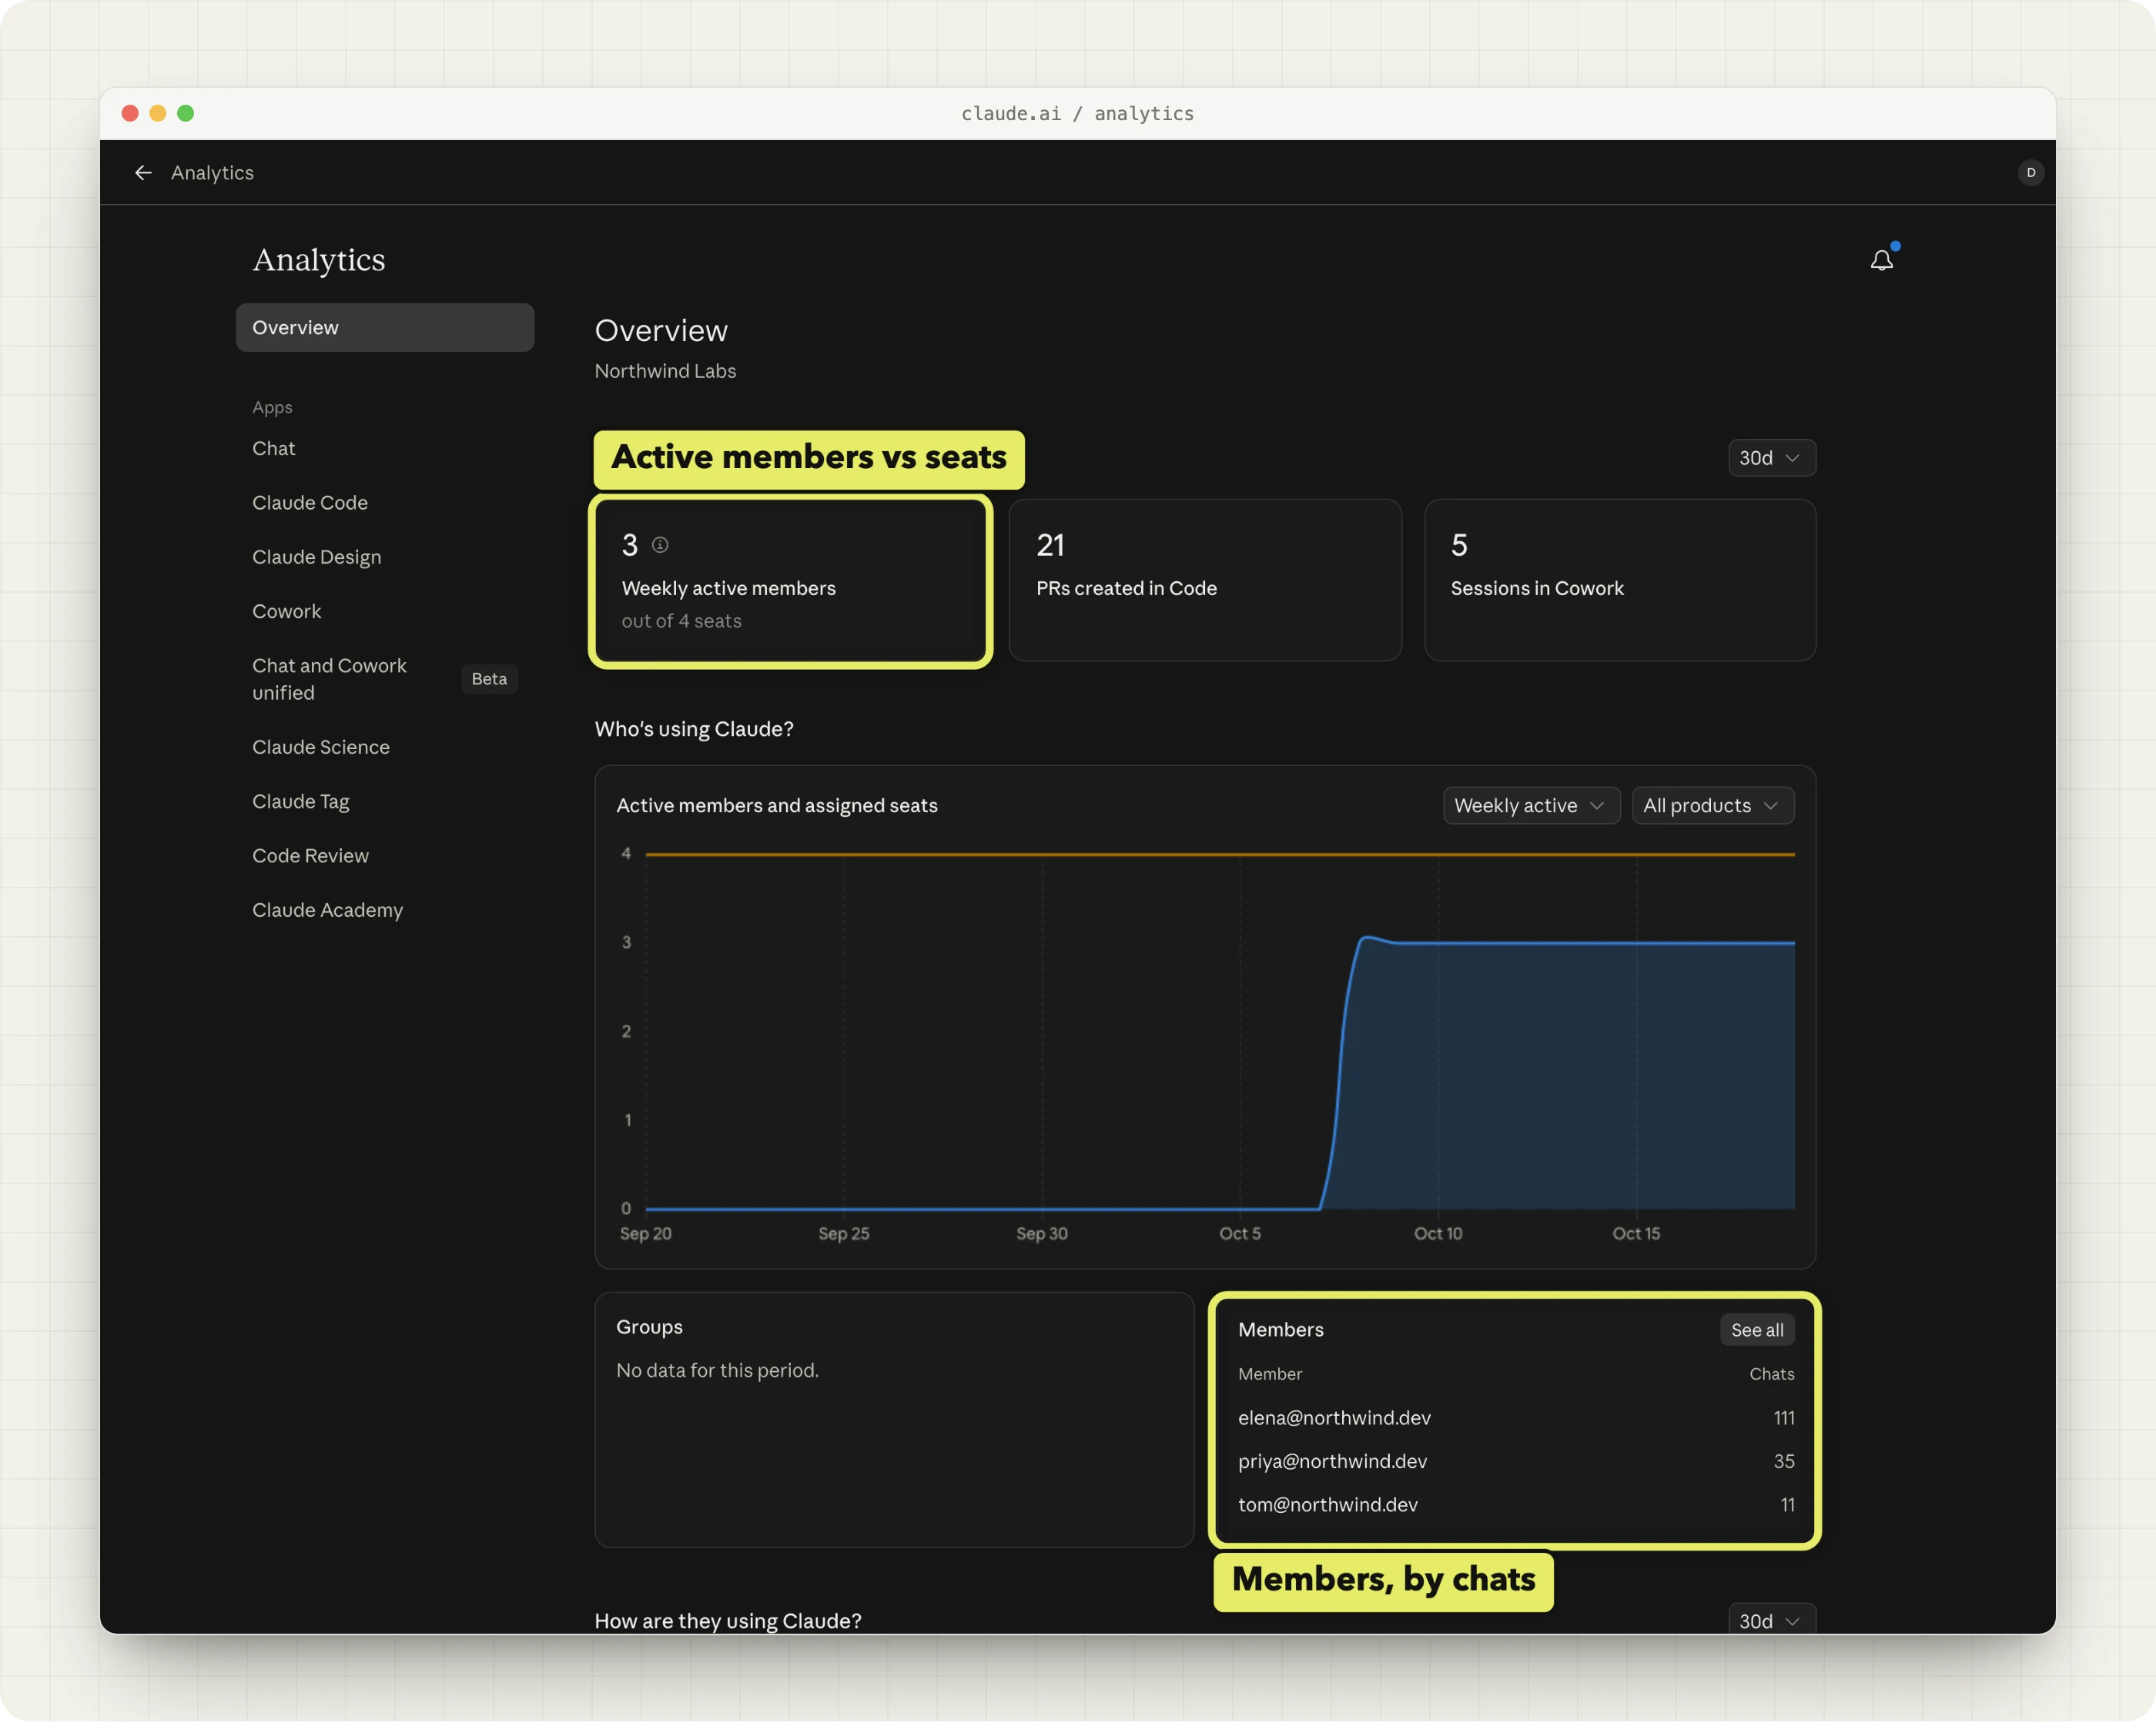
- 3. Choose Analytics. The overview shows weekly active members, active members against assigned seats, and groups.
- 4. Pick a product page. Claude Chat, Claude Code, Claude Design, and Cowork each have their own page.
If Analytics isn’t in the menu, check your role first. Most of the time that’s the reason.
How do I see usage per person?
On the Team plan there are two per-person exports, and you might only have one of them.
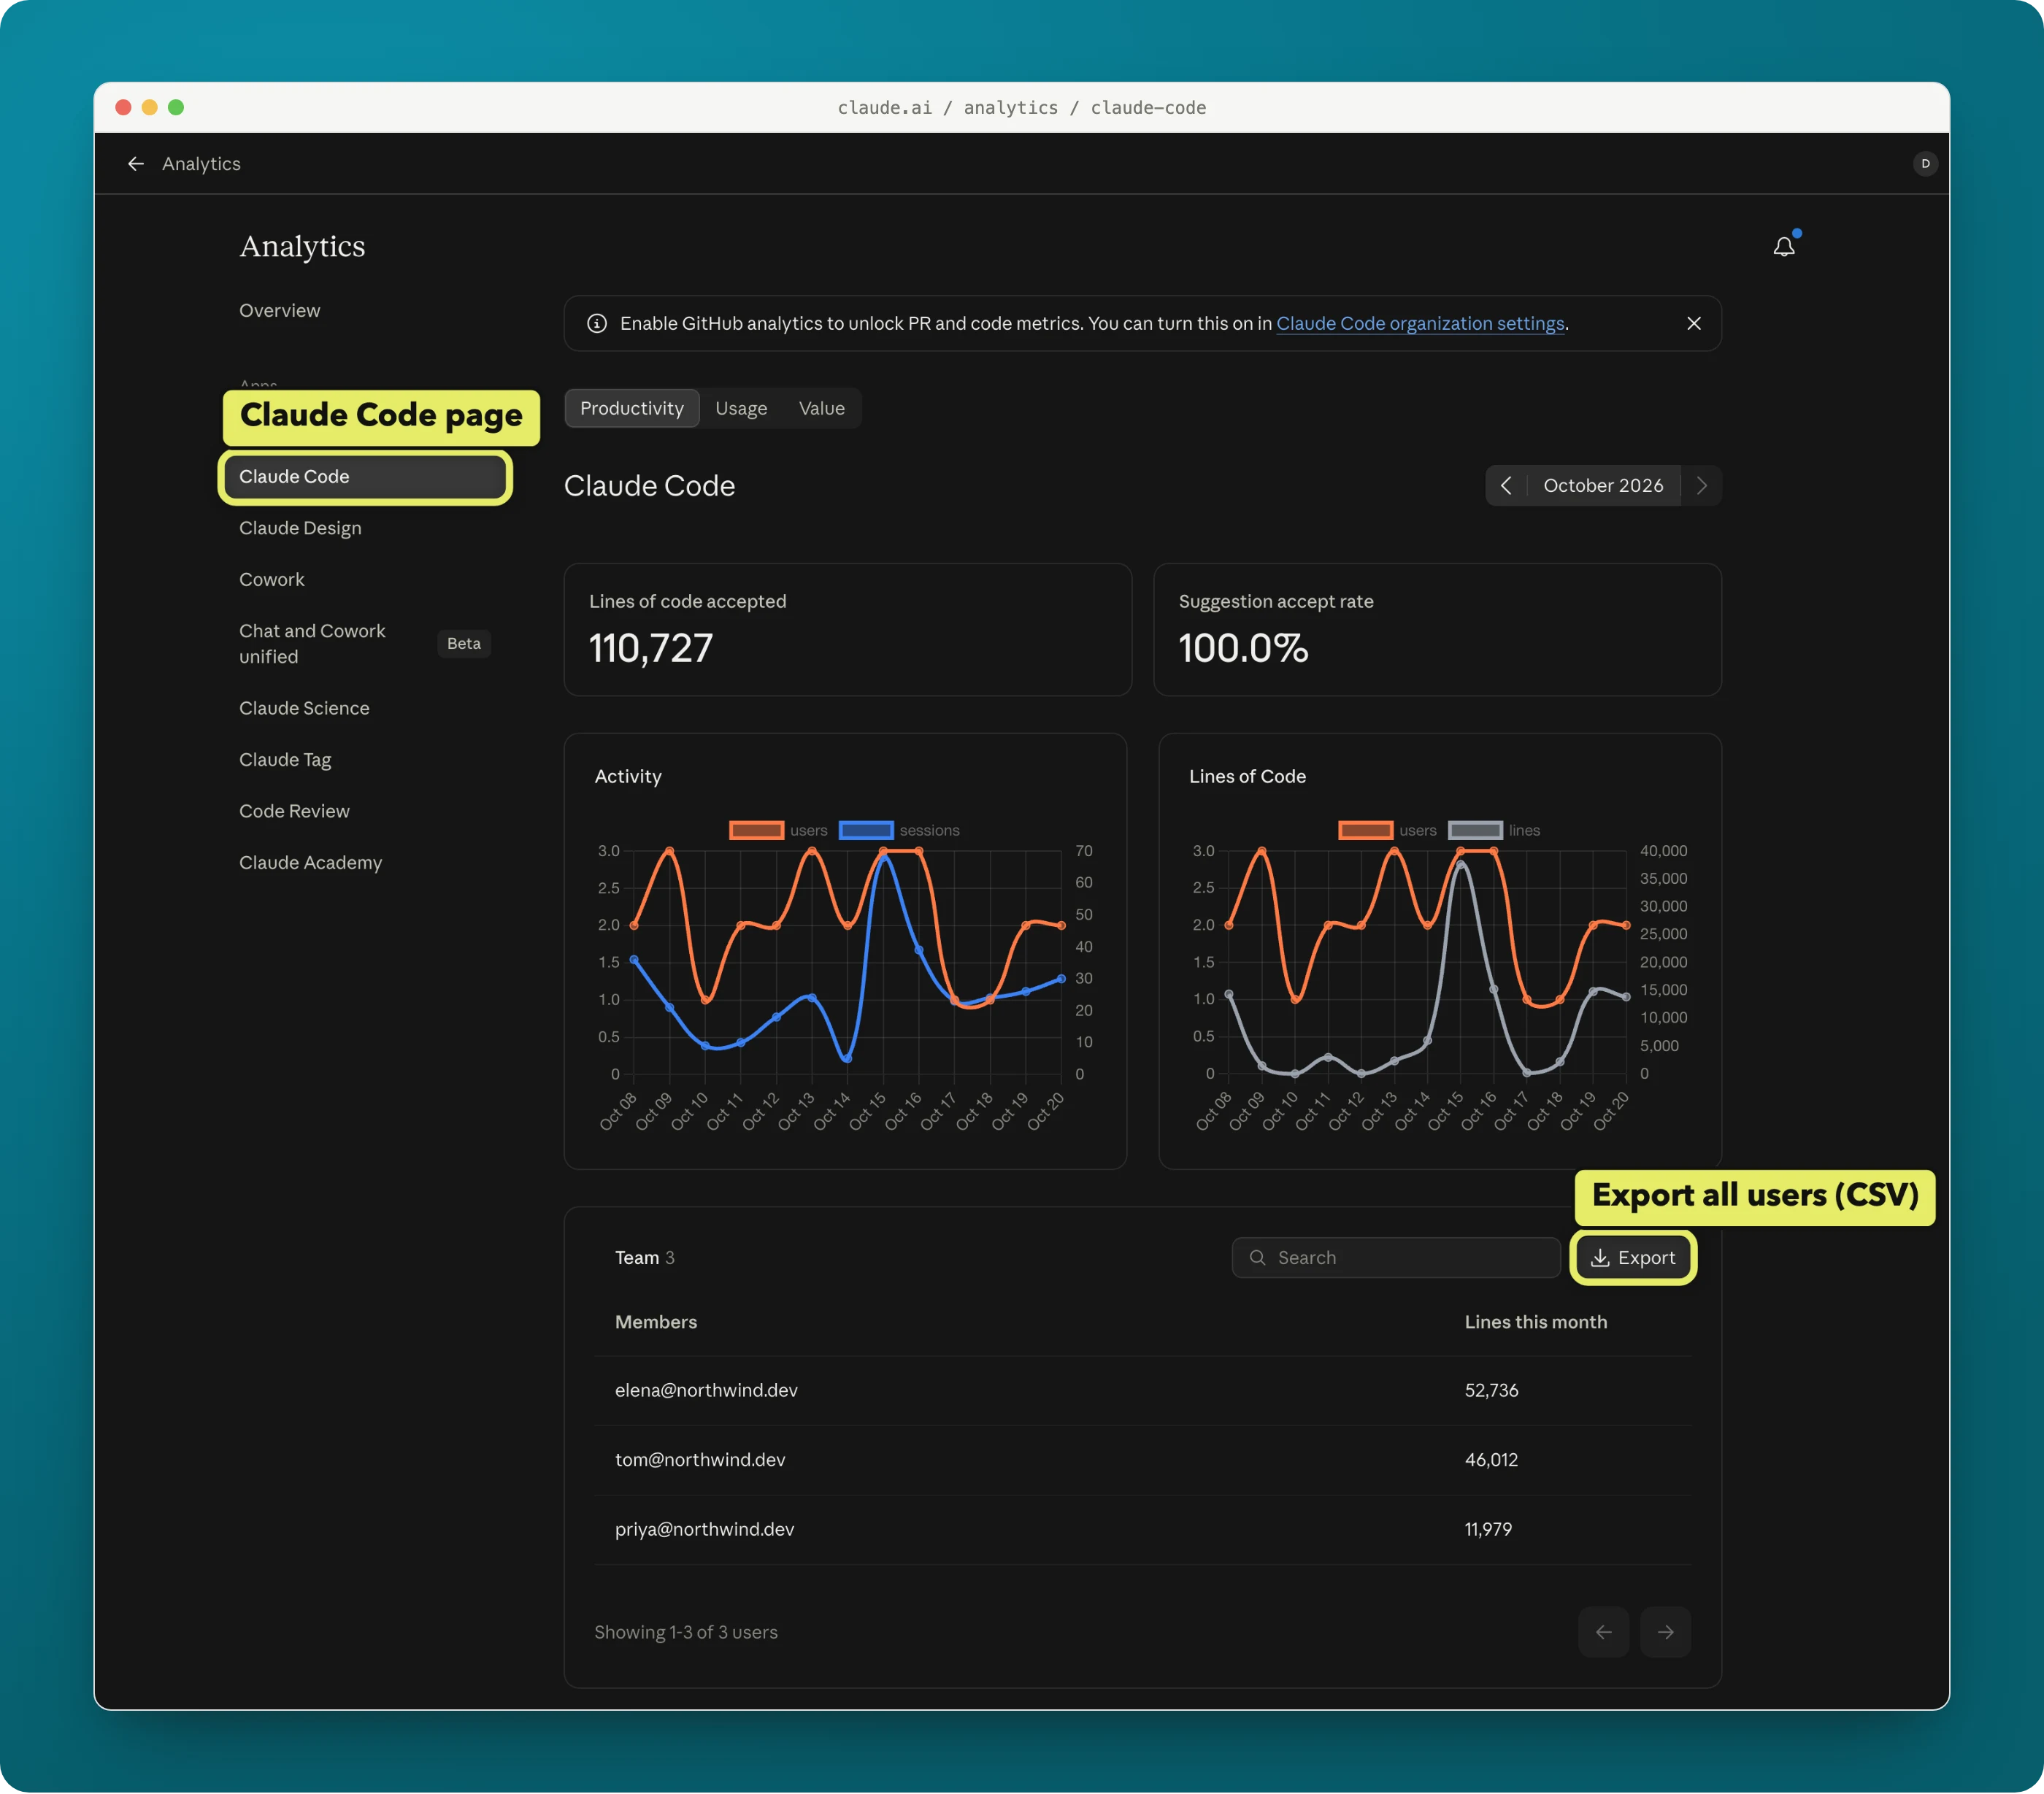
The first is always there: the Claude Code page lists every member with their lines this month, and the Export button downloads the full list as a CSV. More on that below.
The second is the spend report, which Anthropic’s help article describes. It only appears when your organization has extra usage (usage credits) turned on. On the Team org we checked, which doesn’t, the whole “How much is Claude costing?” section is missing. If you have it:
- 1. Open Analytics and scroll to How much is Claude costing?
- 2. Click Export spend report.
- 3. Choose month to date, last month, last 90 days, or a custom range. Custom ranges only go back 90 days.
- 4. Click Download.
Each row is one person’s use of one model over the range you picked: email, product, model, request count, prompt and completion tokens, and spend. Sort by tokens and you’ll see where the usage is within a minute. Without extra usage, you’re limited to the Claude Code export and the Members table on the overview.
Two things to keep in mind. The data is a day behind. And on seat-based Enterprise the report only counts usage above the seat allowance, so a heavy user who stays within their seat looks like they used nothing.
Where is Claude Code usage?
Claude Code has its own dashboard at claude.ai/analytics/claude-code. It shows daily active users, sessions, lines of code accepted, and suggestion accept rate. If an Owner turns on GitHub analytics under claude.ai/admin-settings/claude-code, you also get pull requests and lines shipped with Claude Code.
The leaderboard shows the top 10 people. Click Export all users to get everyone as a CSV. Anthropic’s Claude Code analytics docs cover the details, including how pull requests get attributed.
What doesn’t the Team plan show?
- No per-member view. Member analytics is for Enterprise on usage-based billing only.
- No API. The Analytics API is Enterprise only, so you can’t pull Team usage into your own dashboard.
- No limit tracking. Nothing tells you how close each person gets to their 5-hour or weekly limit, or how often they hit it.
- Only the Claude organization. Usage on personal Claude accounts or API keys outside your org doesn’t show up.
The third gap is the one that matters for seat decisions. Tokens tell you how much someone used. They don’t tell you whether that person kept running into a wall. There’s more on how the limits work in Claude Team usage limits, explained.
| Claude Team admin | Claude Enterprise admin | UseJunction | |
|---|---|---|---|
| Tokens and spend per person | Spend report CSV, only with extra usage on | Yes, CSV and API | Estimated, per tool and model |
| Claude Code activity per person | Leaderboard export | Leaderboard export and API | Yes |
| Seat type per person | Members list | Members list | Yes, next to limit usage |
| 5-hour and weekly limit usage | No | No | Yes, over time |
| Member analytics view | No | Usage-based billing only | Yes |
| API or raw data access | No | Yes | Yes, your own database if self-hosted |
| Personal accounts outside the org | No | No | Yes |
Should each person get a Standard or Premium seat?
A Team plan lets you mix seat types, and Premium costs several times as much as Standard. Check Anthropic’s Team plan page for current prices. The goal is simple: Premium for people who keep hitting limits, Standard for everyone else. The Premium vs Standard seat guide goes through the break-even math.
Here’s the rule of thumb we use:
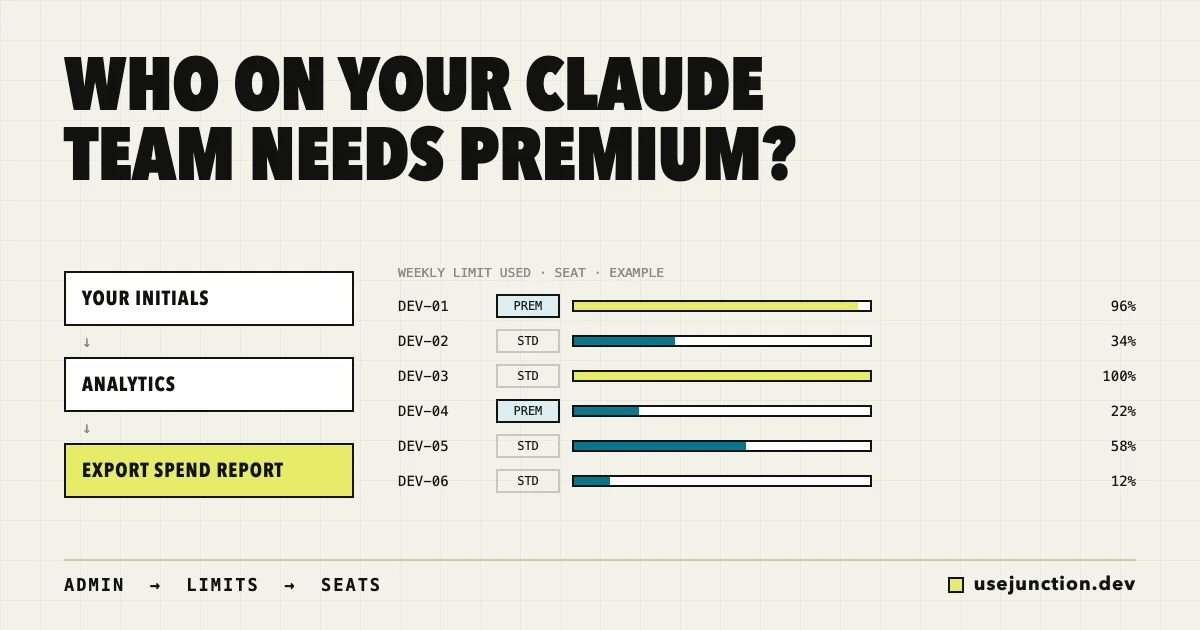
- Hits the weekly limit most weeks: move them to Premium. The lost hours cost more than the seat.
- Hits the 5-hour limit a few times a week but not the weekly one: keep them on Standard for now. Their usage comes in bursts, and a bigger weekly allowance won’t change much.
- Rarely uses half the weekly allowance: Standard, or ask whether they need a seat at all.
- Buys extra usage every month: compare what they spent on extra usage with the price difference. Often Premium is cheaper.
Look at a few weeks before deciding. One big week from a launch or a migration isn’t a pattern.
On the Claude for Startups program?
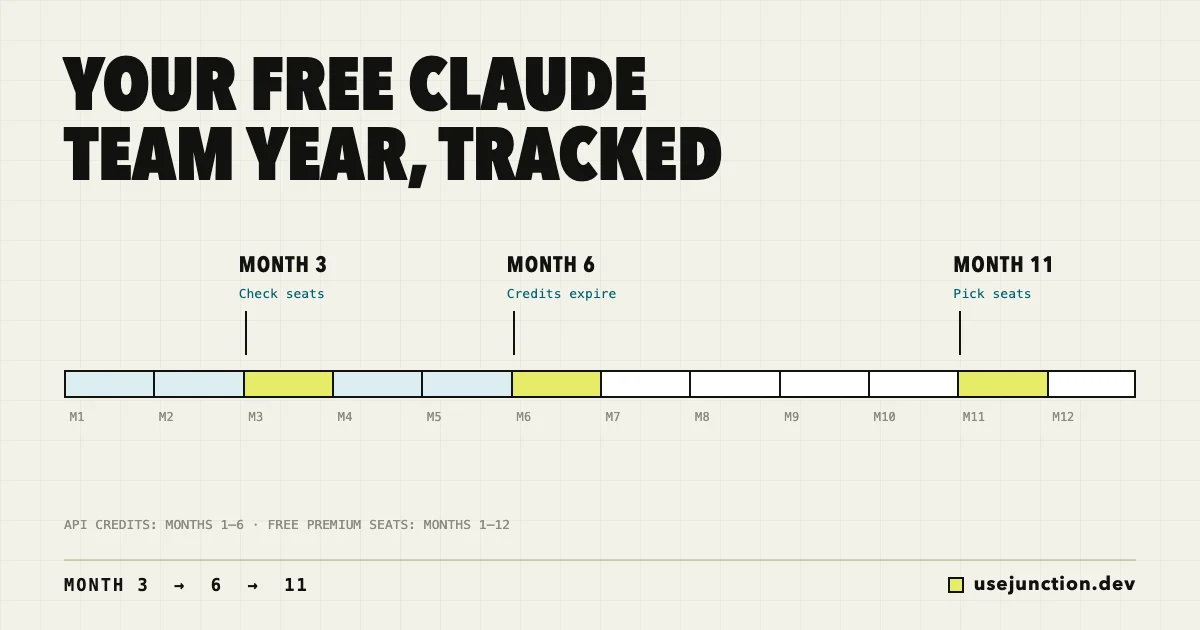
When the Claude for Startups program reopened in October 2026, the launch announcement included a free year of Claude Team with up to five Premium seats. The cohort filled within days. If you got in, that’s a good deal, but it also means nobody is checking which seats get used. When the free year ends you’ll be choosing between Standard and Premium for each person, and it helps to have a year of real limit data instead of a guess. We wrote up what to track during the free year.
Start tracking now. The month before renewal is too late to learn who your heavy users are.
How do I see each person’s limits and seat type?
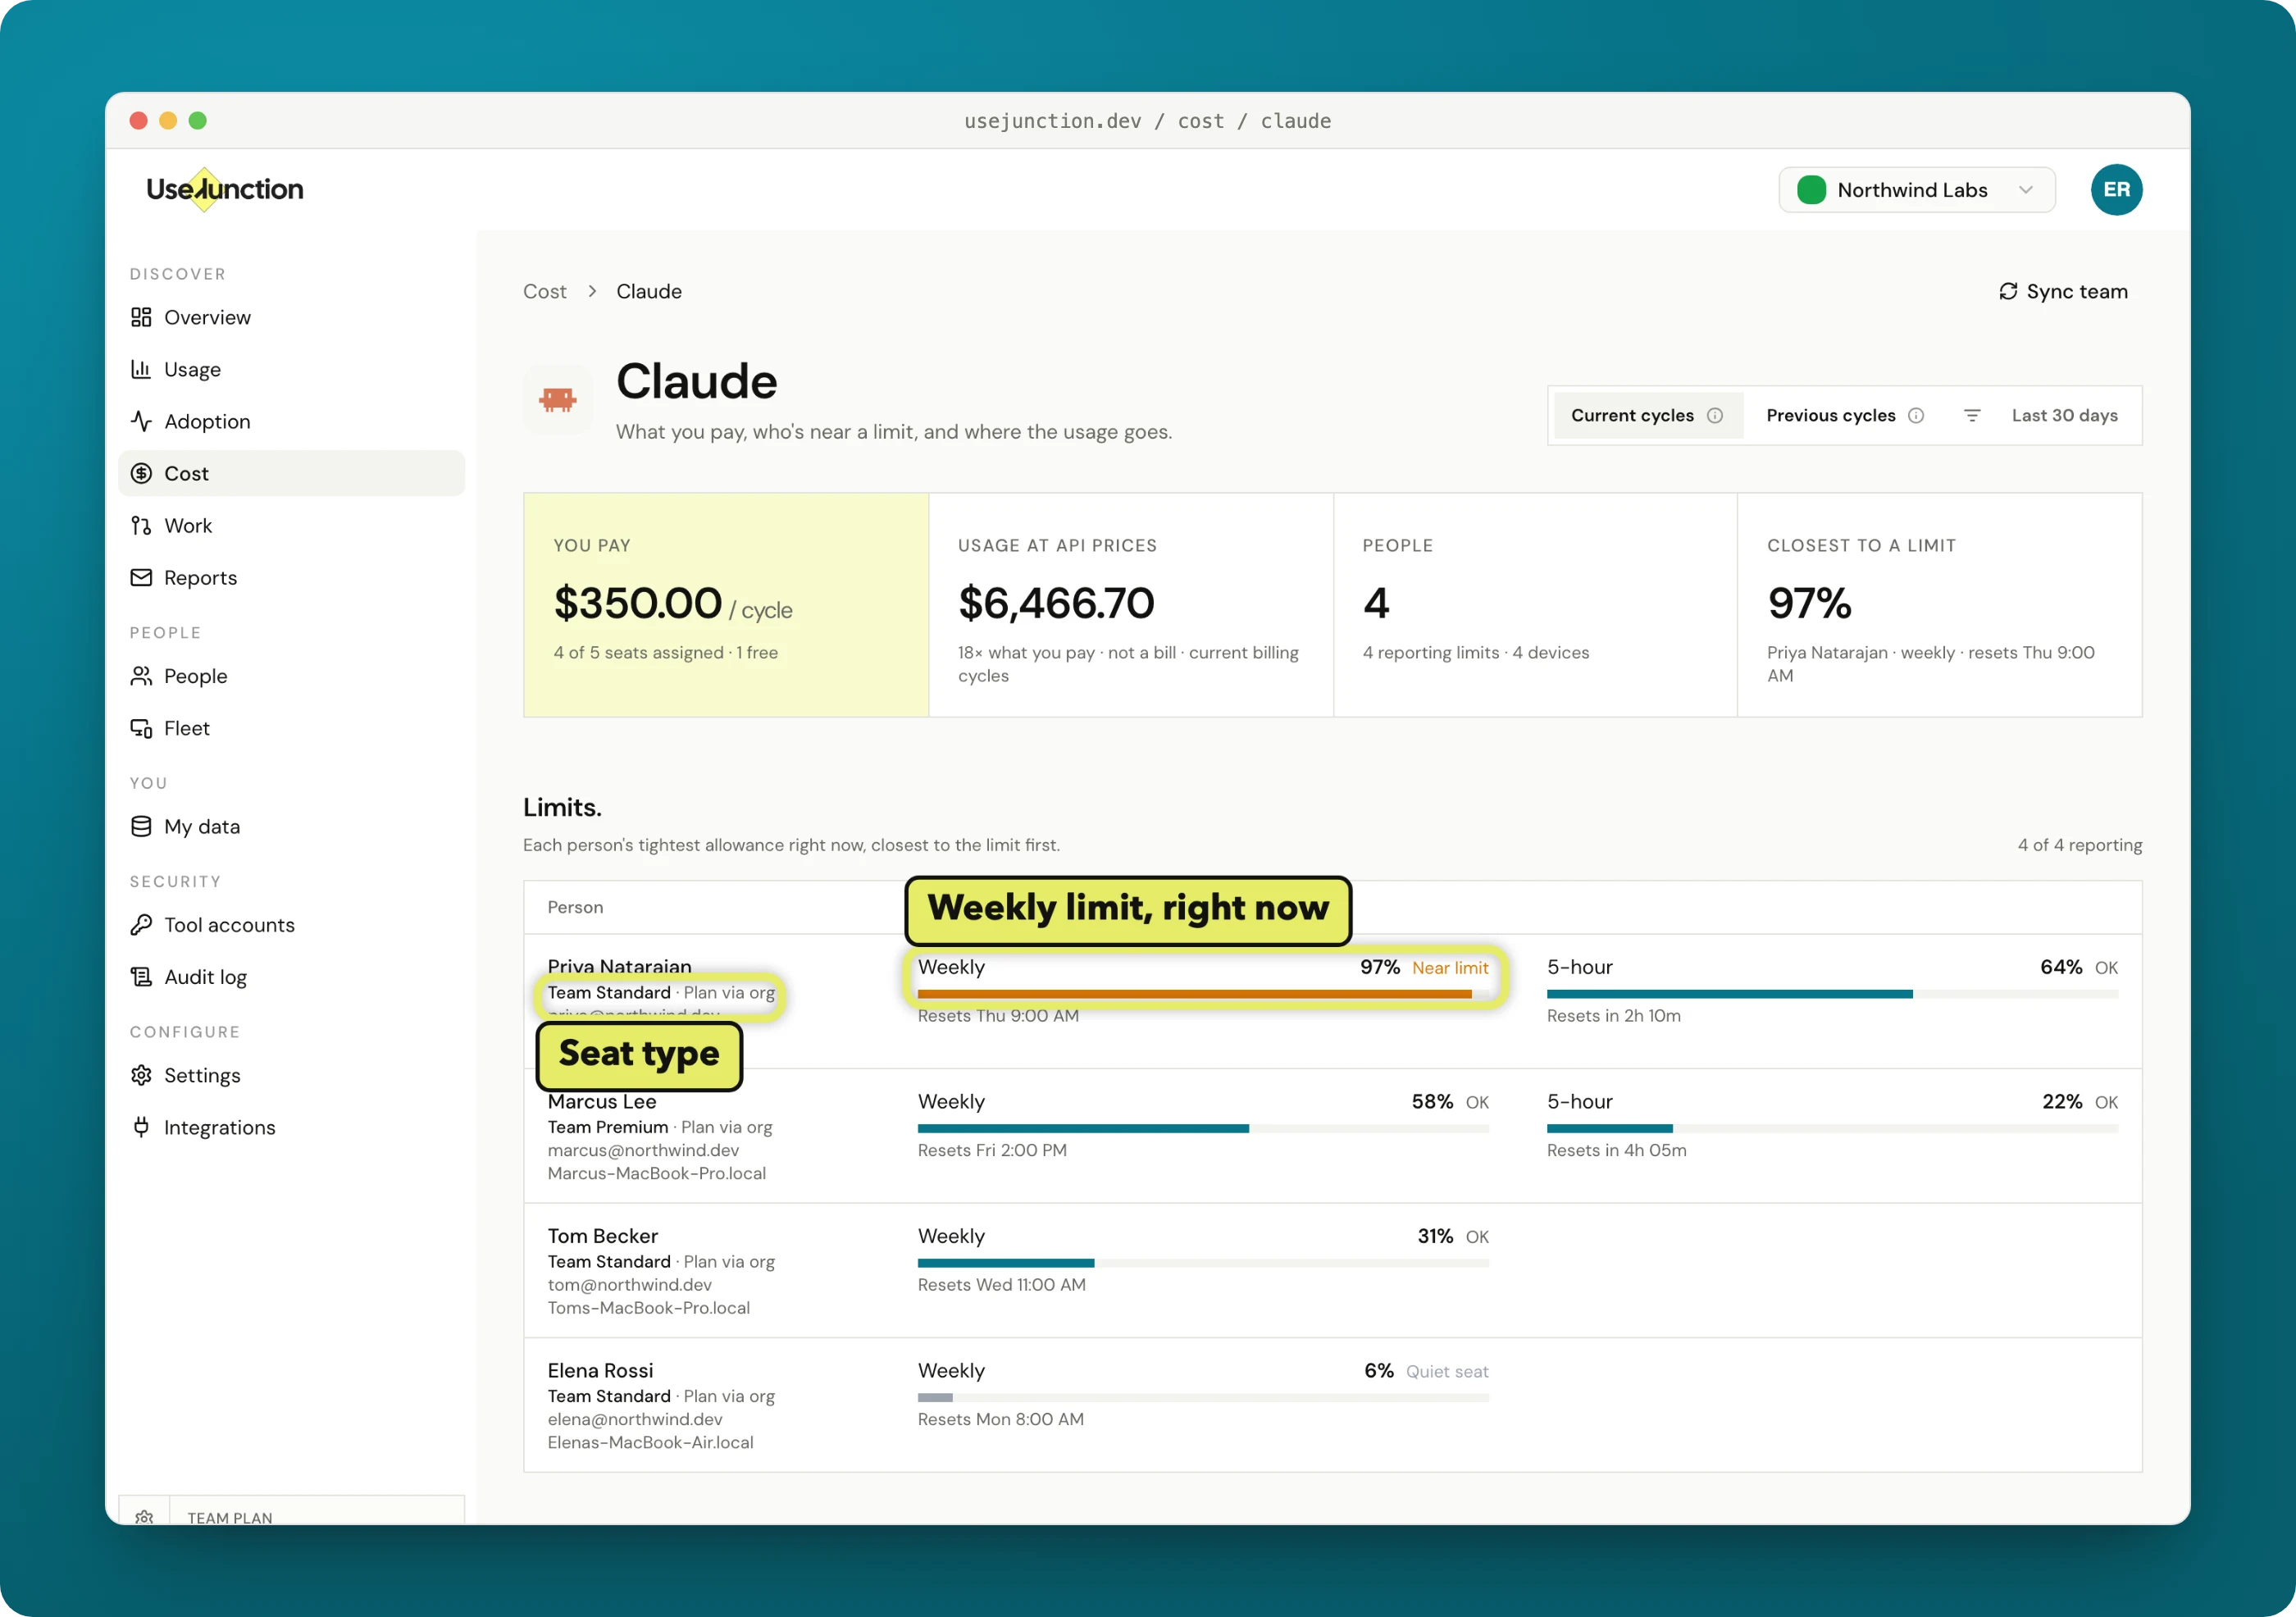
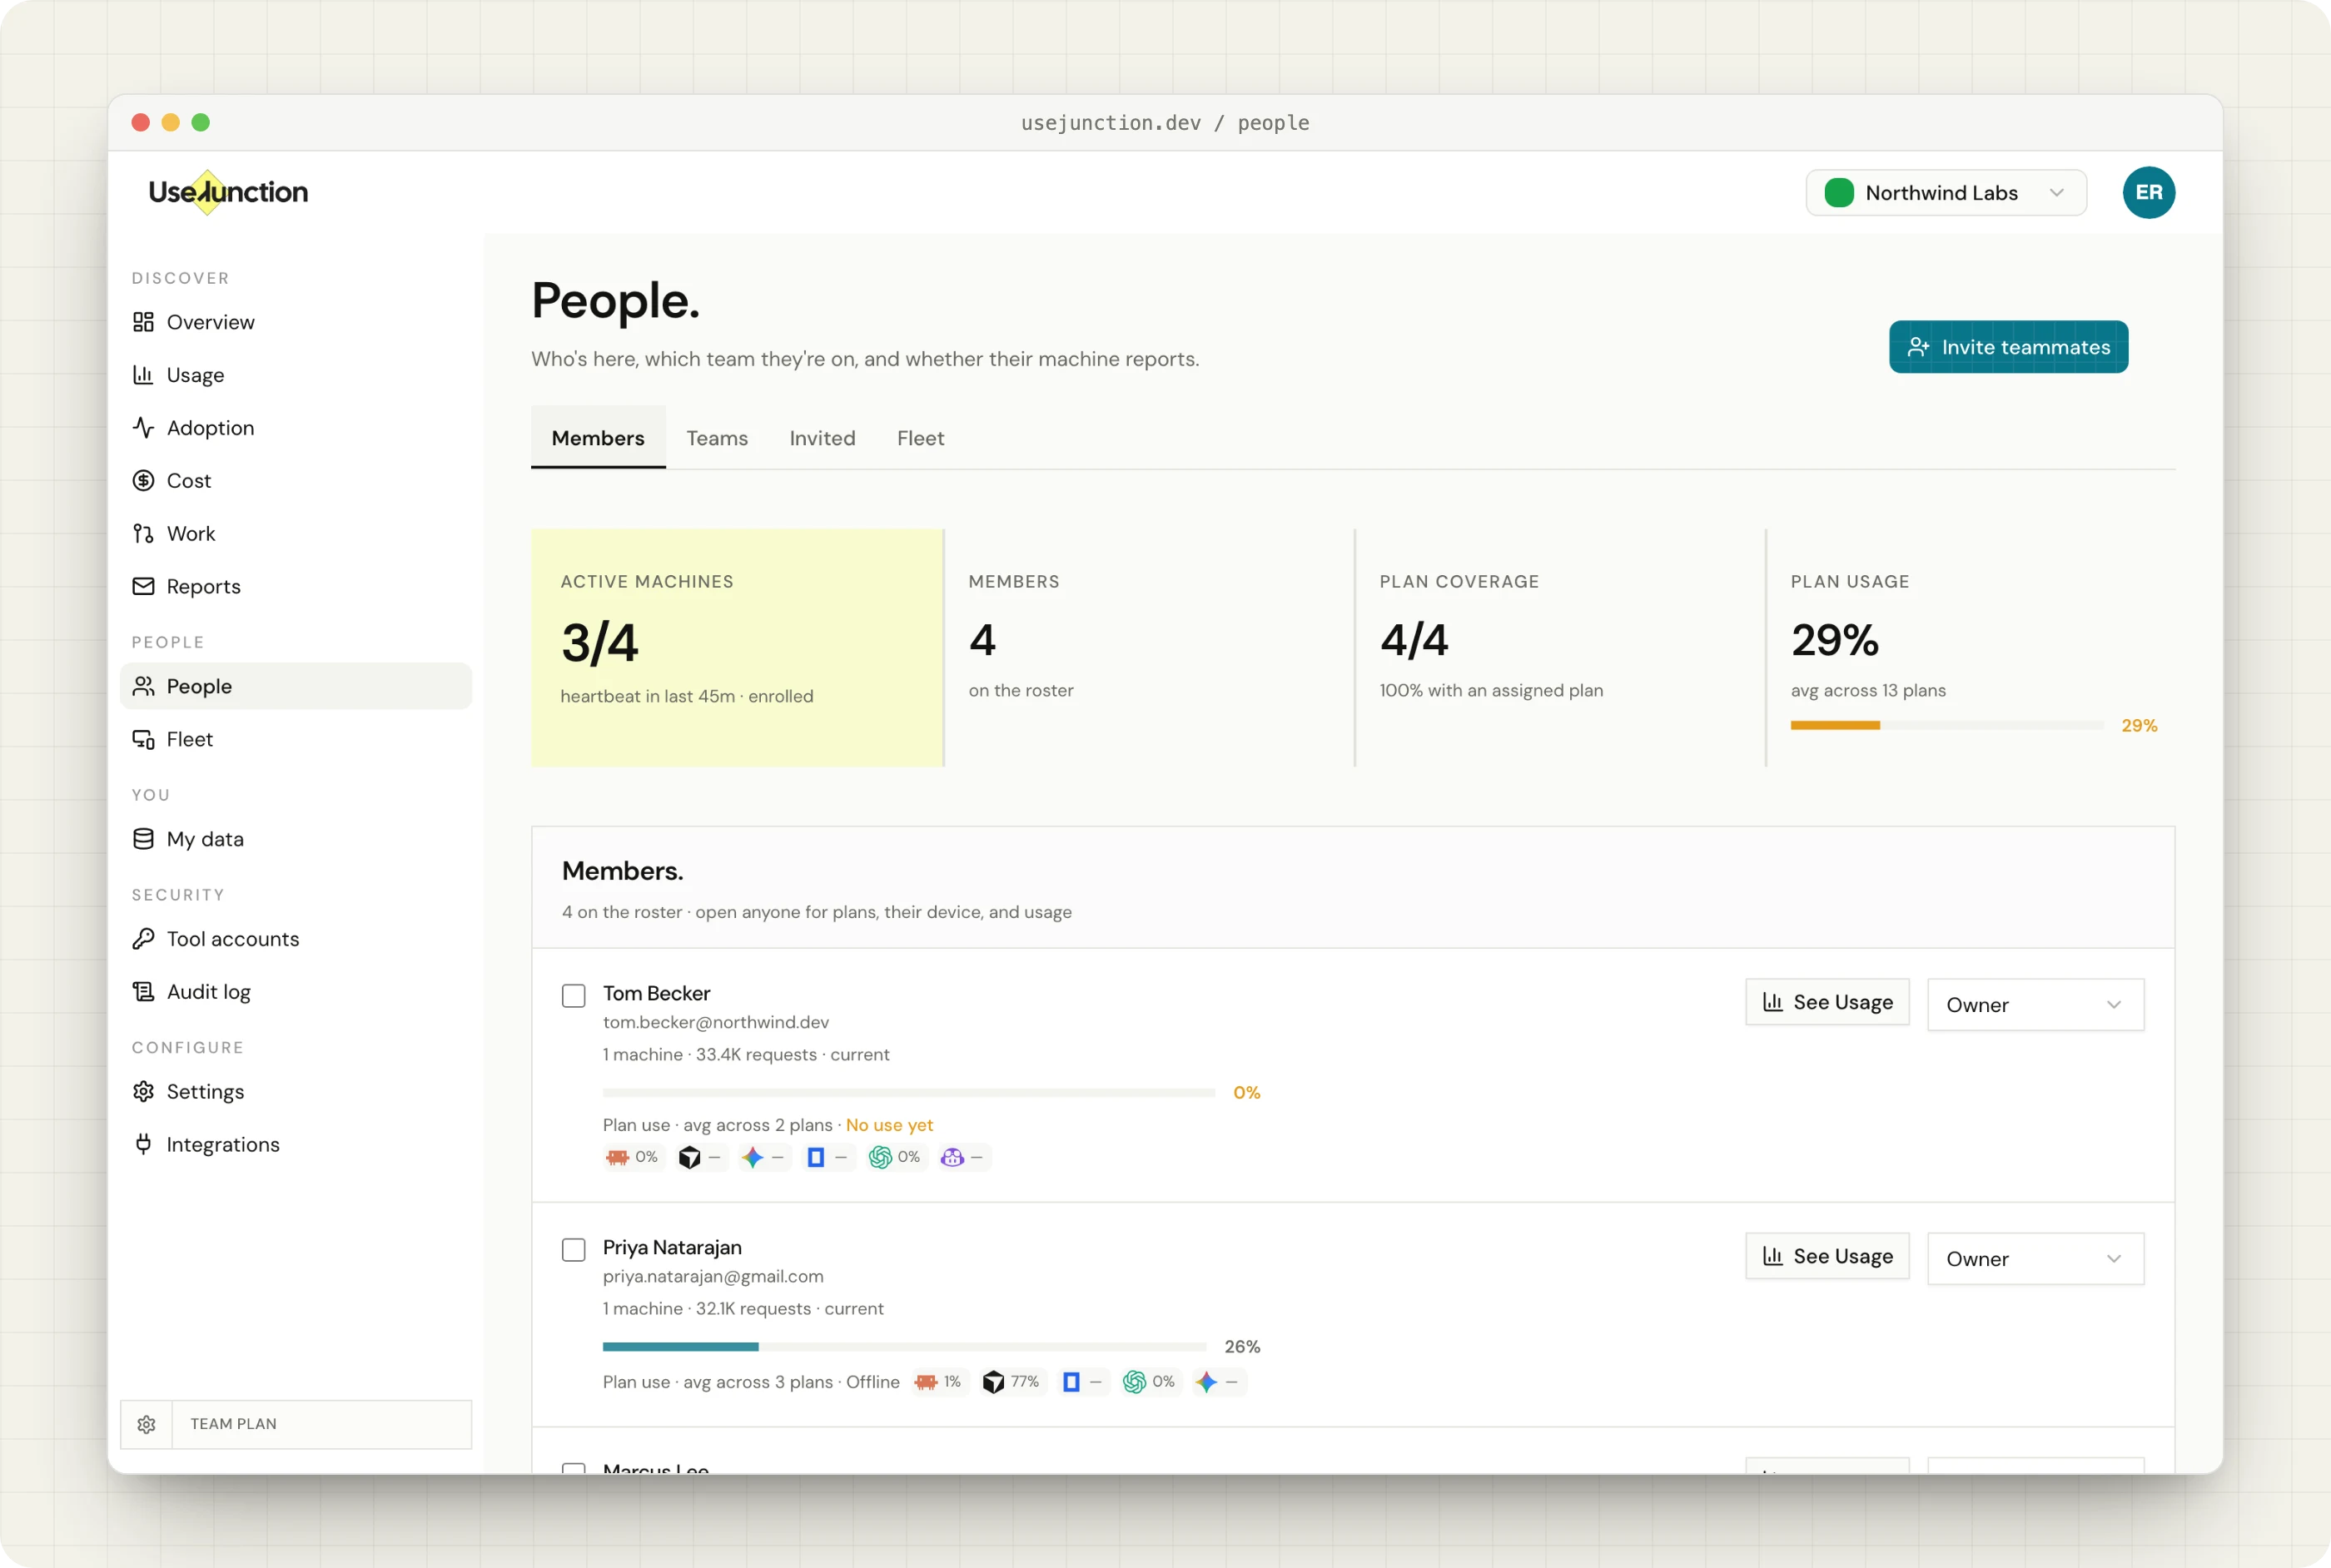
This is the part we built UseJunction for. A small agent on each person’s Mac or Windows machine reads the same usage numbers Claude Code shows that person locally: their seat type (Standard or Premium), and how much of their 5-hour and weekly limits they’ve used. The dashboard puts everyone in one table.
- Seat type per person, so you can see who is on Standard and who is on Premium.
- 5-hour and weekly limit usage over time, so “hits the limit most weeks” is a number, not a feeling.
- Personal accounts next to company ones, so usage outside your Claude org shows up too.
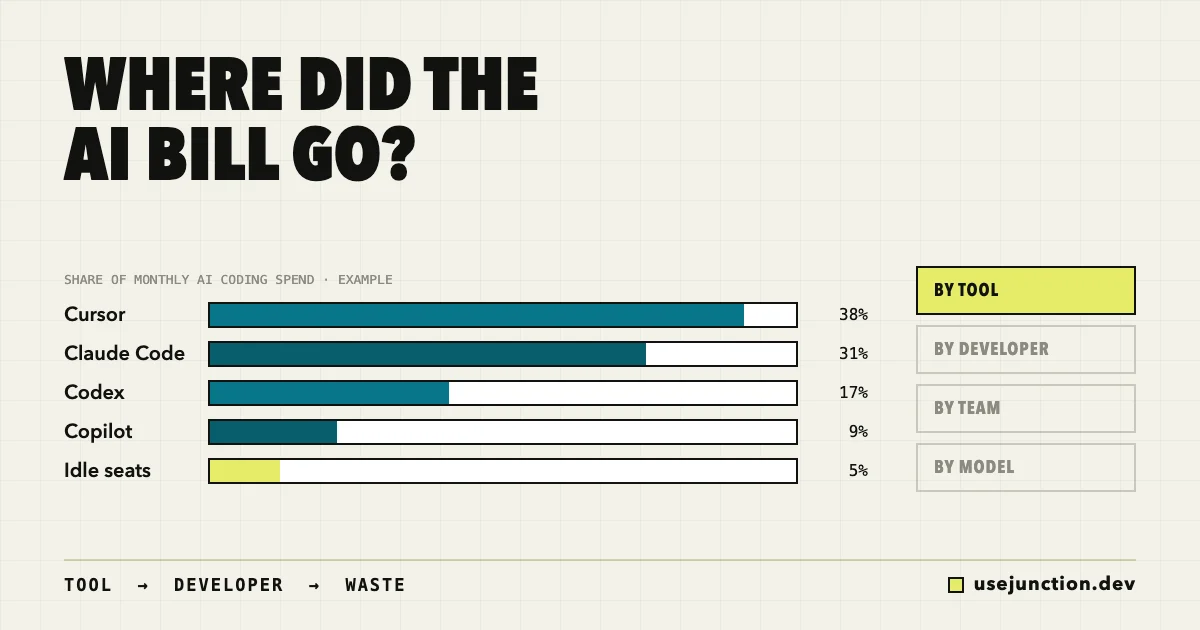
- Cursor, Codex, and Copilot in the same view, if your team uses more than Claude.
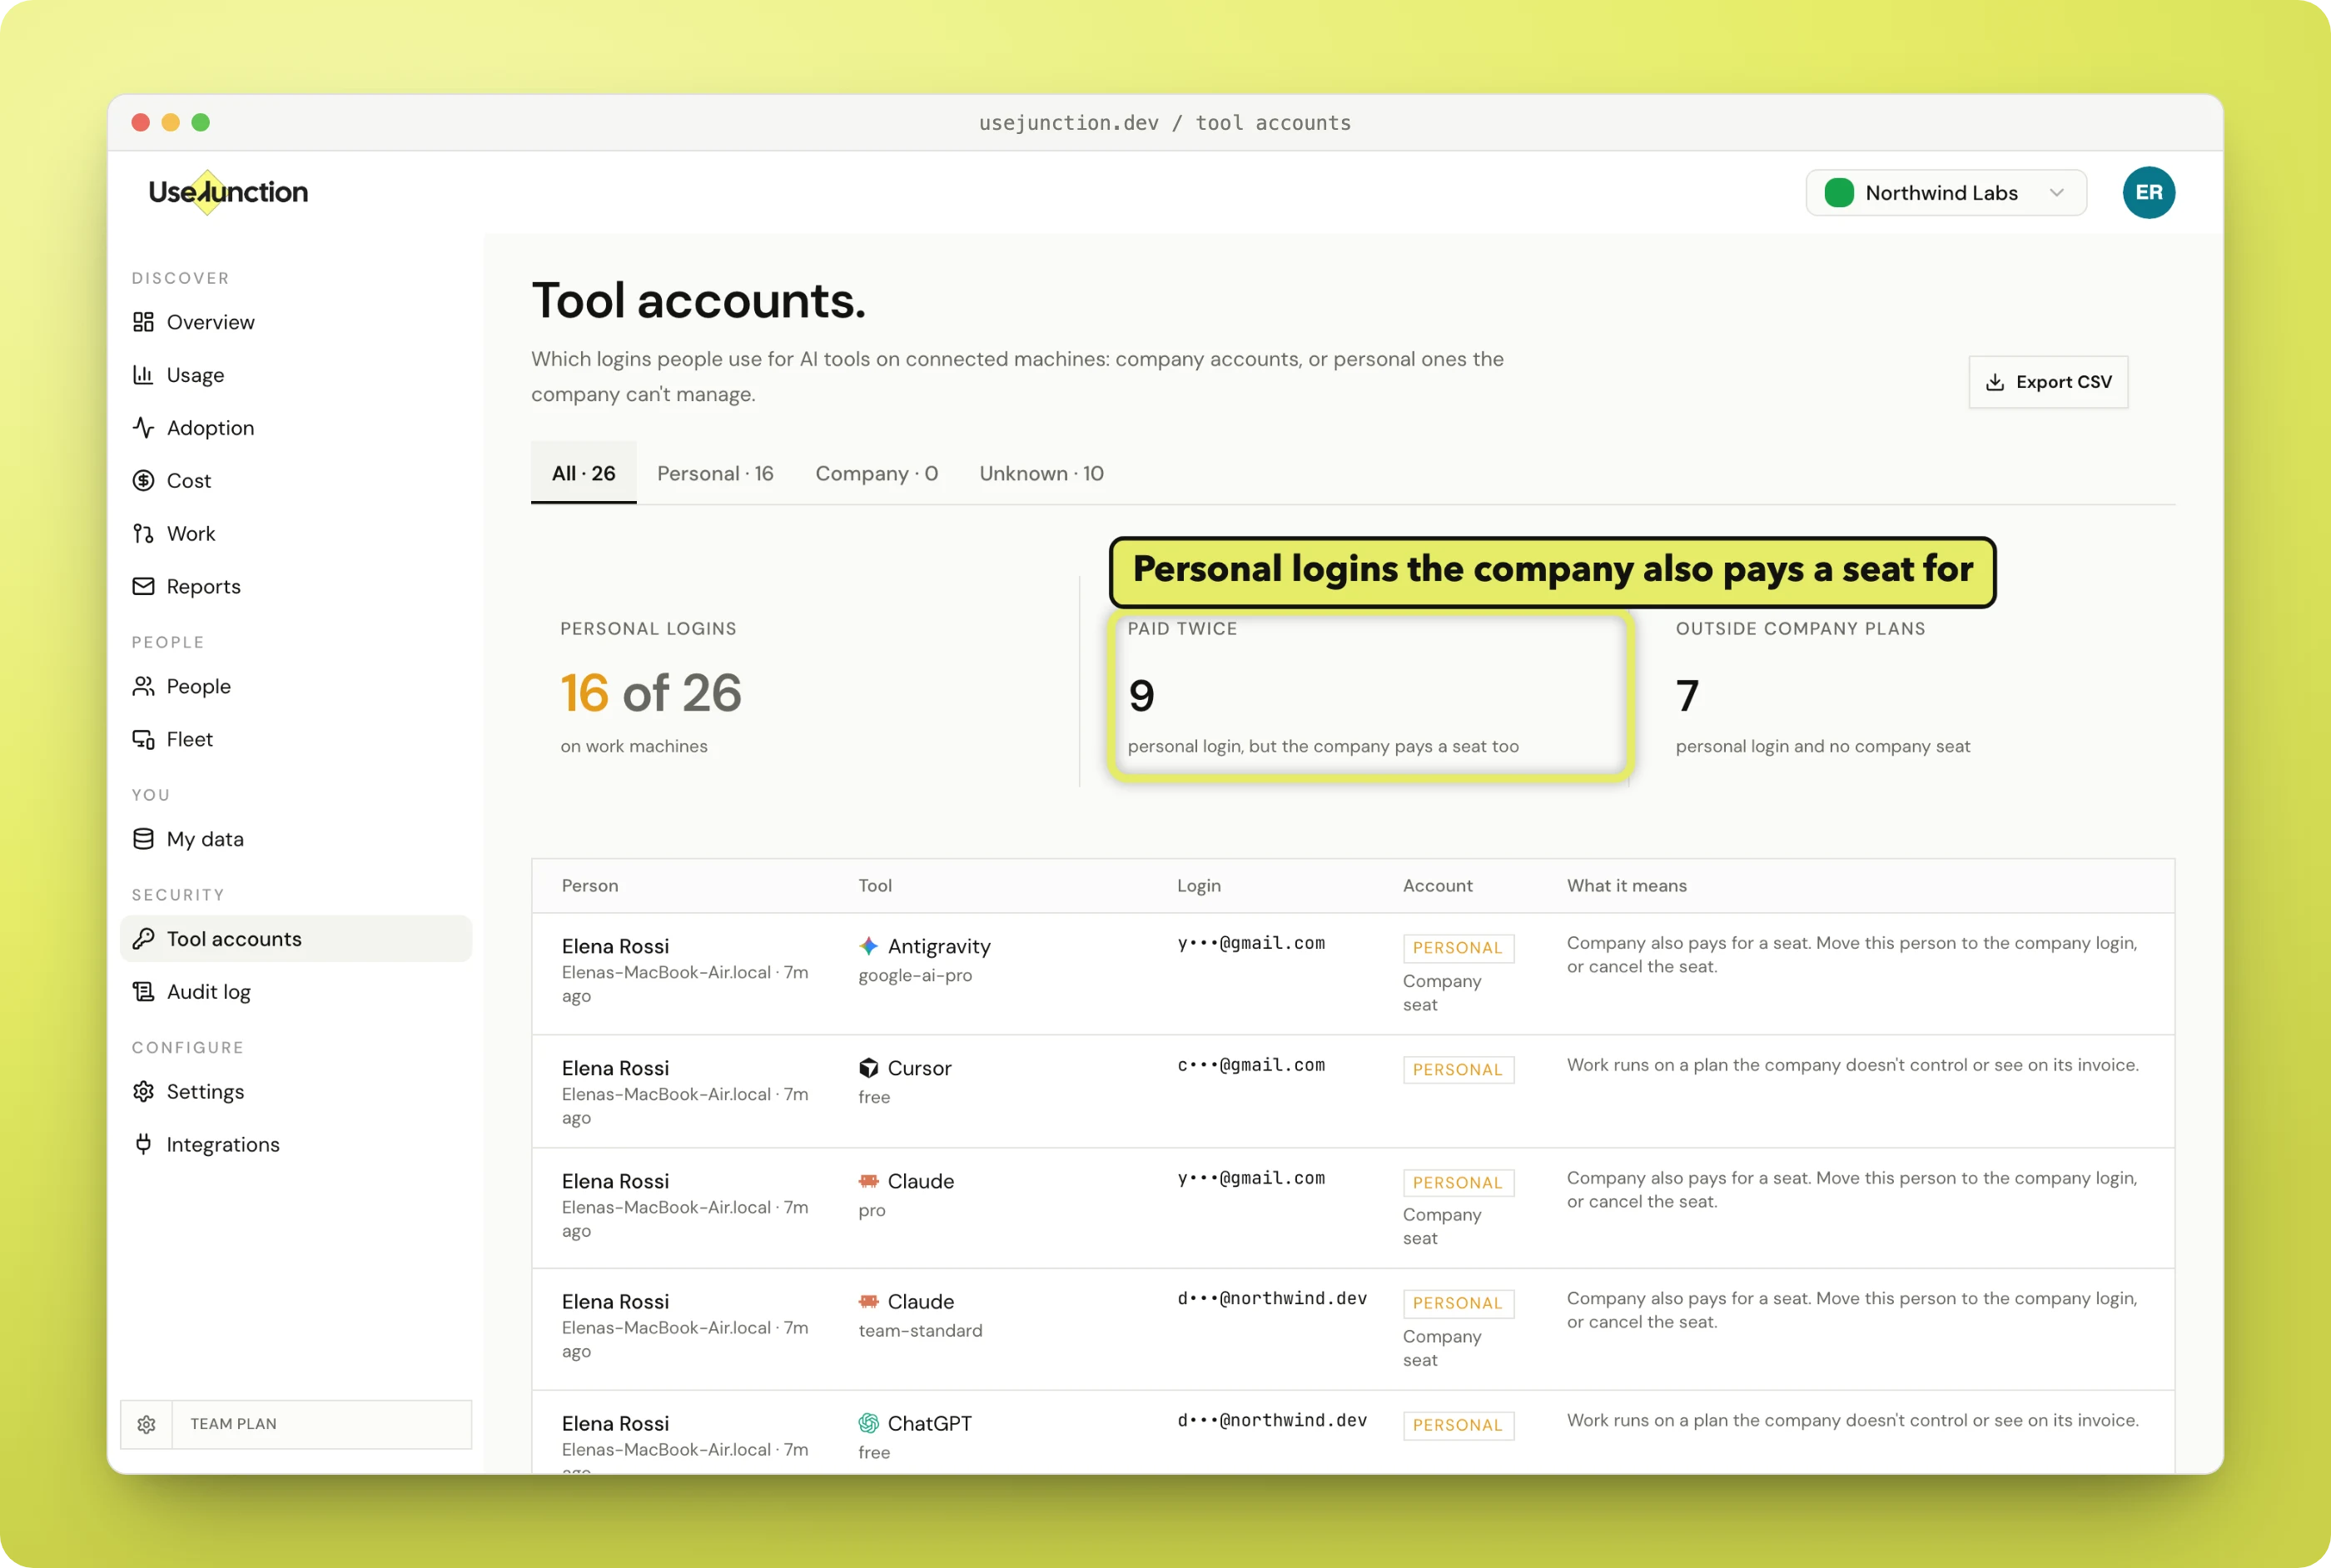
It doesn’t read prompts, code, or screens. It’s open source, and you can self-host it. Sign up for the managed version or run it from GitHub. For the wider picture on idle seats, see how to see plan usage and seat waste.
Frequently asked questions
Where do I see team usage in Claude?
Click your initials in the bottom-left corner of claude.ai and choose Analytics. On the Team plan you need to be an Owner or Primary Owner. On Enterprise, Admins can see it too, except for spend.
Can I see how much each person on my Claude Team plan uses?
Partly. The Claude Code page exports lines of code per person. If extra usage is turned on, the spend report CSV adds requests, tokens, and spend per person and per model. Neither shows how close someone gets to their 5-hour or weekly limit.
Why can’t I find Member analytics on my Team plan?
Member analytics is only available to Enterprise organizations on usage-based billing. The toggle doesn’t appear on Team or seat-based Enterprise.
Does the Claude Team plan have a usage API?
No. The Claude Enterprise Analytics API is Enterprise only. Teams that pay for Claude through the Claude Console (API billing) can use the separate Claude Code Analytics API with an Admin API key.
How do I know if someone needs a Premium seat?
Look at how often they hit their limits. If someone runs into their weekly limit most weeks, or regularly buys extra usage, a Premium seat is likely cheaper than the friction. If they rarely use half their weekly allowance, Standard is enough.
How current is the data in Claude Analytics?
Spend data refreshes once a day, so the newest numbers are from yesterday. Claude Code usage also refreshes daily.
See your AI coding stack as one system.
Usage, cost, plans, and seats for every developer and every tool. Self-host it or use the managed version.
Founder of UseJunction
Dinuda is building UseJunction, an open-source observability layer for the AI coding tools, models, and plans engineering teams already use. His work focuses on making fragmented AI systems visible without turning operational data into developer surveillance.